Rows: 577
Columns: 99
$ Year <fct> 2005, 2005, 2005, 20…
$ StateCode <fct> AL, AK, AZ, AR, CA, …
$ StateName <fct> Alabama, Alaska, Ari…
$ TotalMath <dbl> 559, 519, 530, 552, …
$ TotalTestTakers <dbl> 3985, 3996, 18184, 1…
$ TotalVerbal <dbl> 567, 523, 526, 563, …
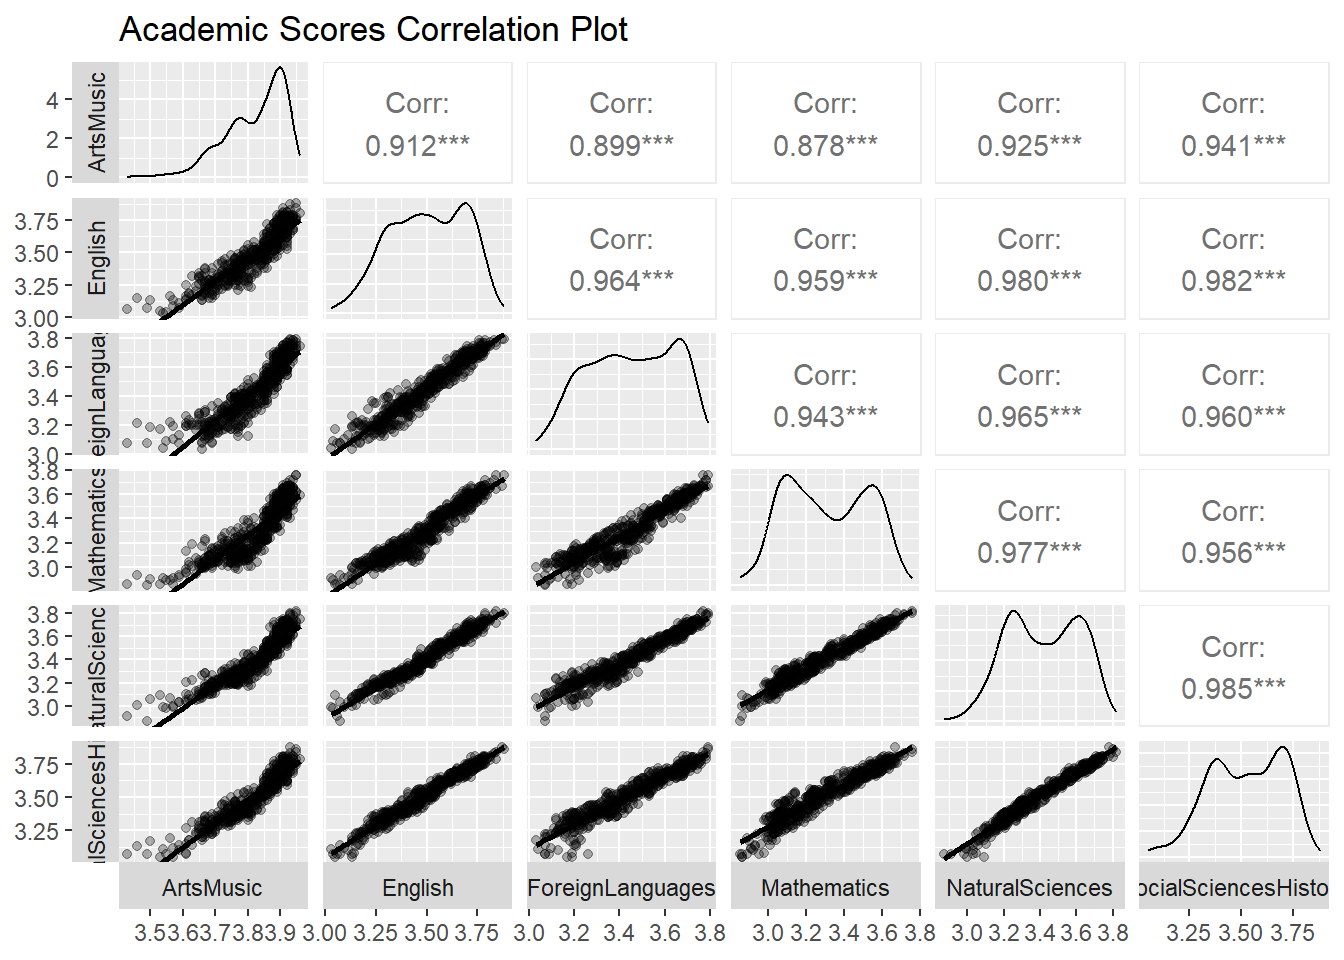
$ AcademicSubjectsArtsMusicAverageGpa <dbl> 3.92, 3.76, 3.85, 3.…
$ AcademicSubjectsArtsMusicAverageYears <dbl> 2.2, 1.9, 2.1, 2.2, …
$ AcademicSubjectsEnglishAverageGpa <dbl> 3.53, 3.35, 3.45, 3.…
$ AcademicSubjectsEnglishAverageYears <dbl> 3.9, 3.9, 3.9, 4.0, …
$ AcademicSubjectsForeignLanguagesAverageGpa <dbl> 3.54, 3.34, 3.41, 3.…
$ AcademicSubjectsForeignLanguagesAverageYears <dbl> 2.6, 2.1, 2.6, 2.6, …
$ AcademicSubjectsMathematicsAverageGpa <dbl> 3.41, 3.06, 3.25, 3.…
$ AcademicSubjectsMathematicsAverageYears <dbl> 4.0, 3.5, 3.9, 4.1, …
$ AcademicSubjectsNaturalSciencesAverageGpa <dbl> 3.52, 3.25, 3.43, 3.…
$ AcademicSubjectsNaturalSciencesAverageYears <dbl> 3.9, 3.2, 3.4, 3.7, …
$ AcademicSubjectsSocialSciencesHistoryAverageGpa <dbl> 3.59, 3.39, 3.55, 3.…
$ AcademicSubjectsSocialSciencesHistoryAverageYears <dbl> 3.9, 3.4, 3.3, 3.6, …
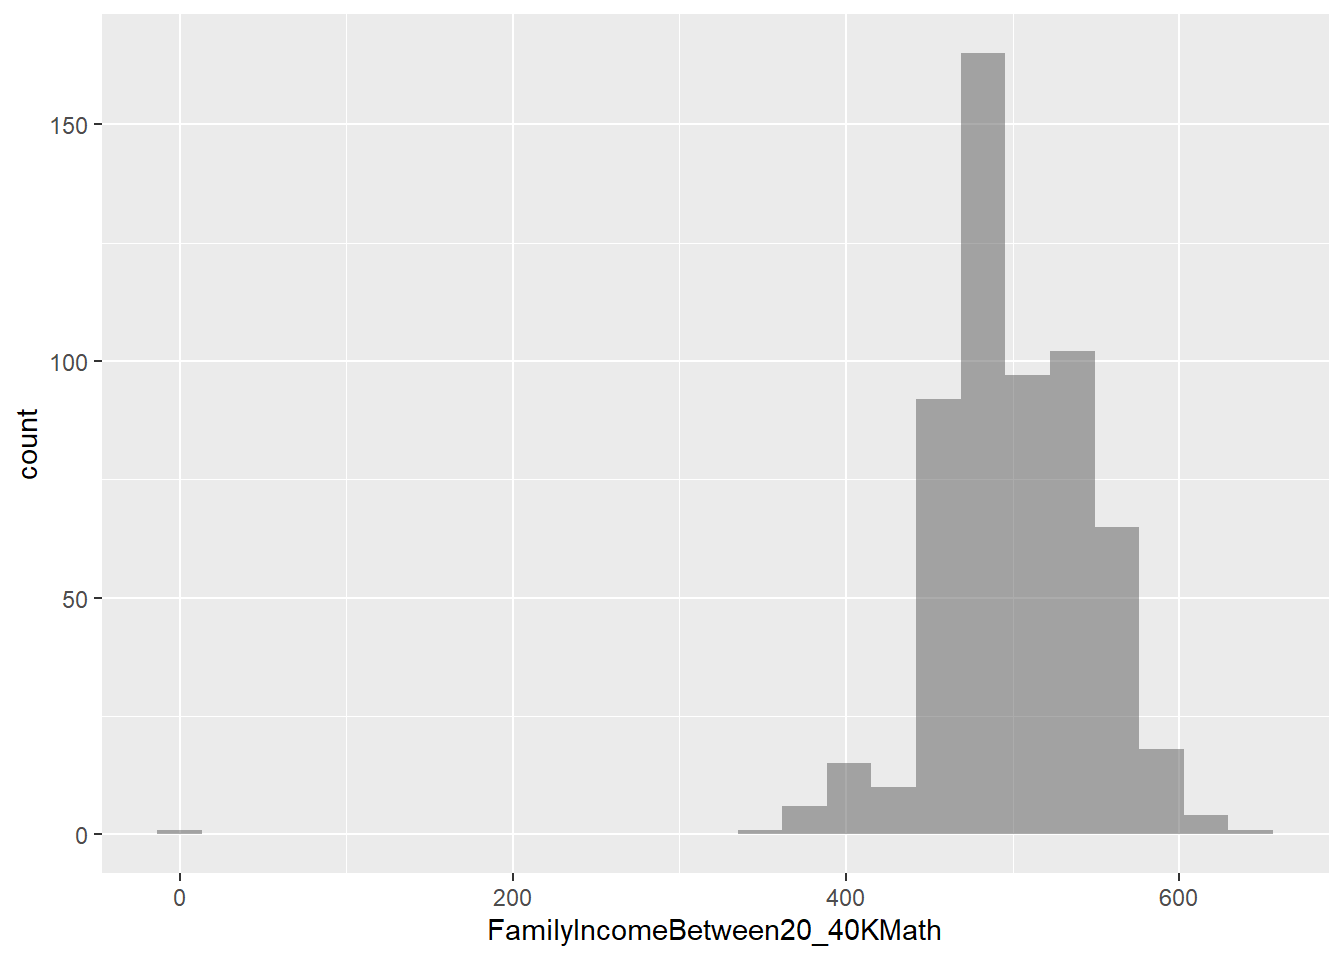
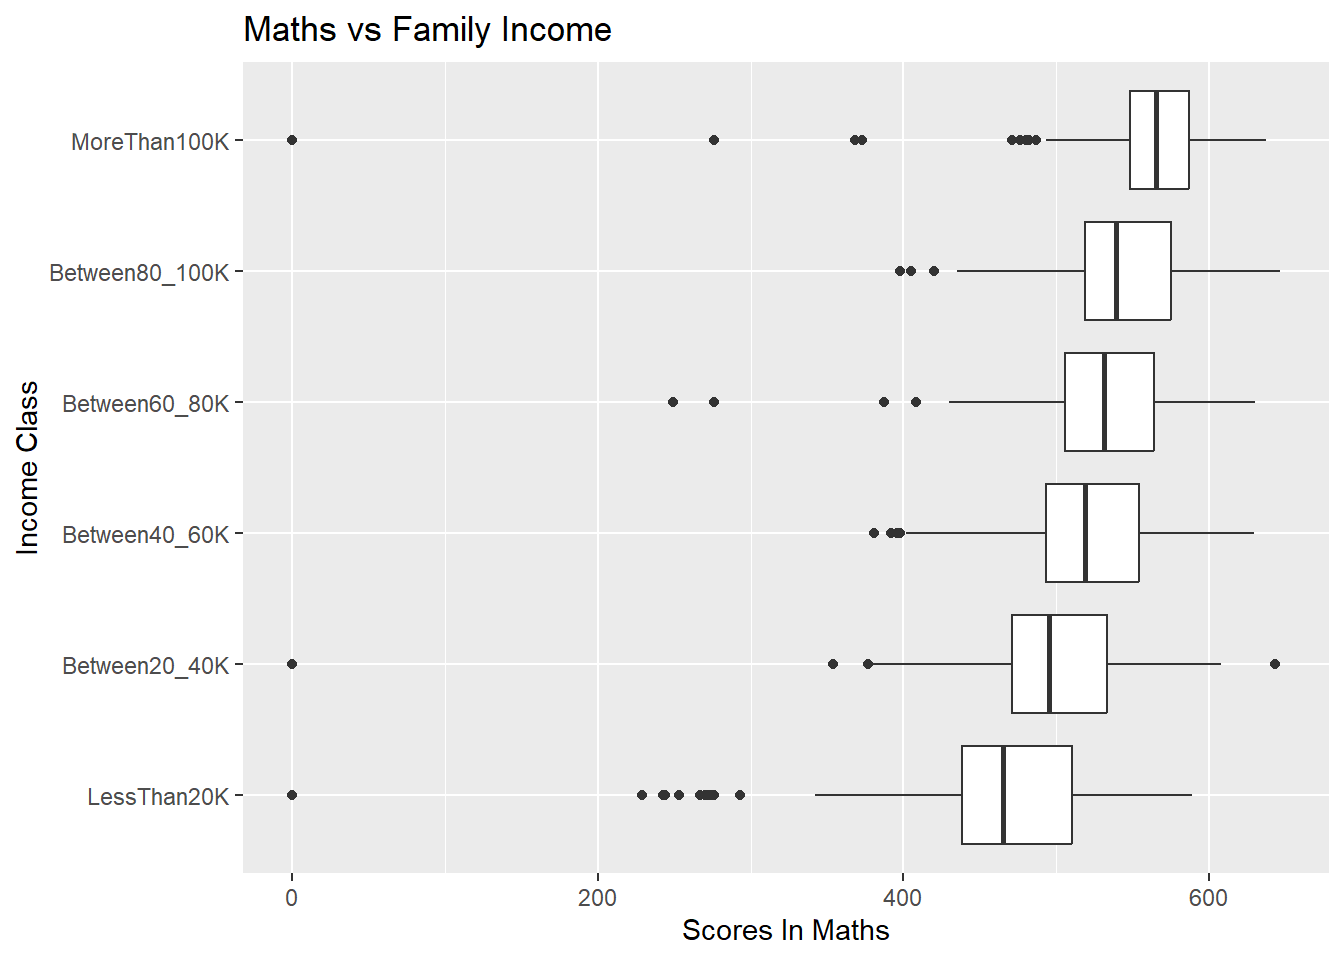
$ FamilyIncomeBetween20_40KMath <dbl> 513, 492, 498, 513, …
$ FamilyIncomeBetween20_40KTestTakers <dbl> 324, 401, 2121, 180,…
$ FamilyIncomeBetween20_40KVerbal <dbl> 527, 500, 495, 526, …
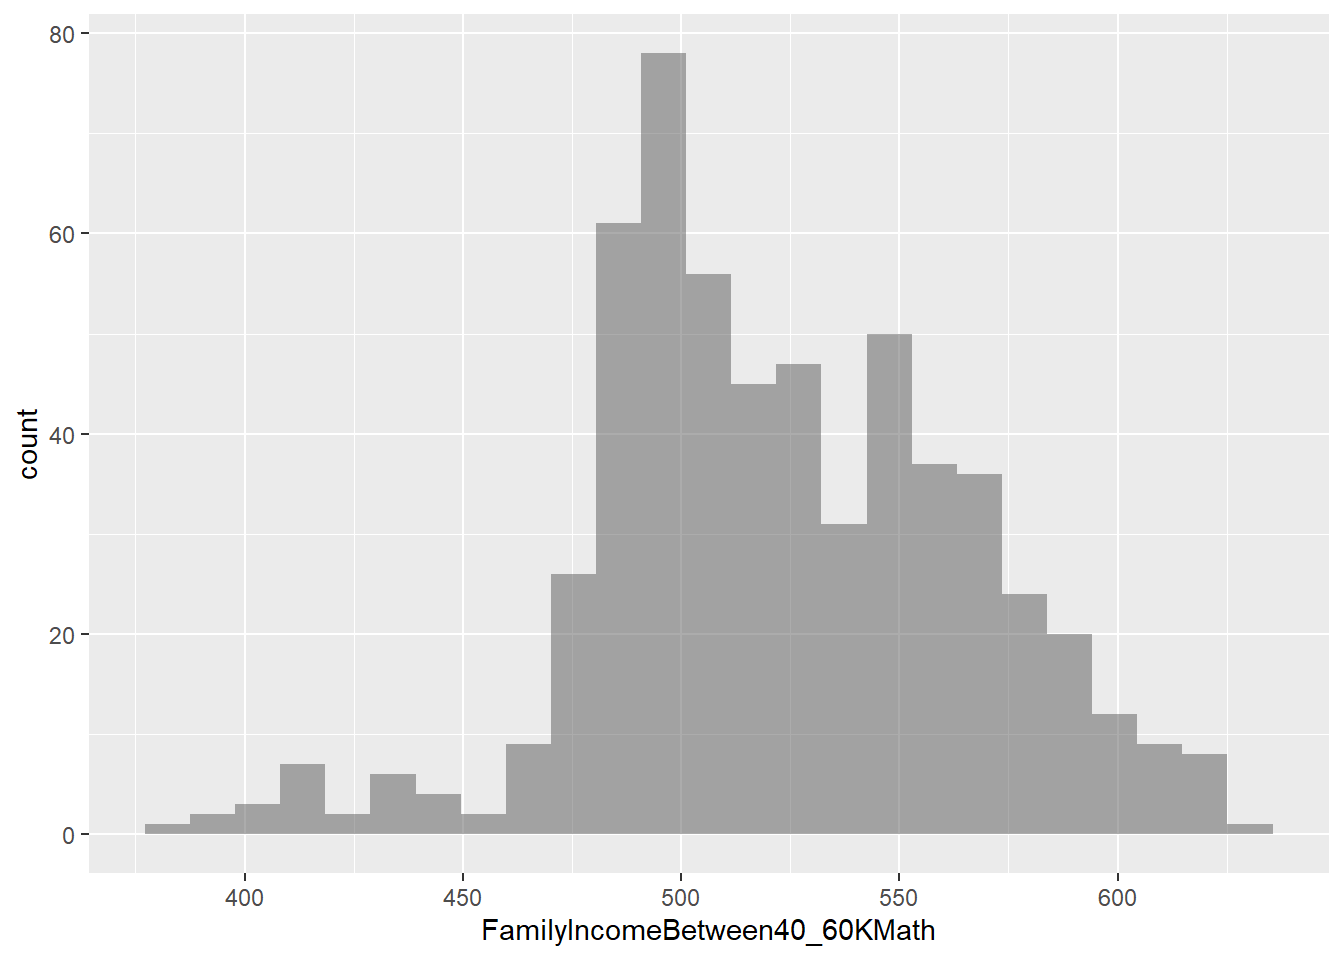
$ FamilyIncomeBetween40_60KMath <dbl> 539, 517, 520, 543, …
$ FamilyIncomeBetween40_60KTestTakers <dbl> 442, 539, 2270, 245,…
$ FamilyIncomeBetween40_60KVerbal <dbl> 551, 522, 518, 555, …
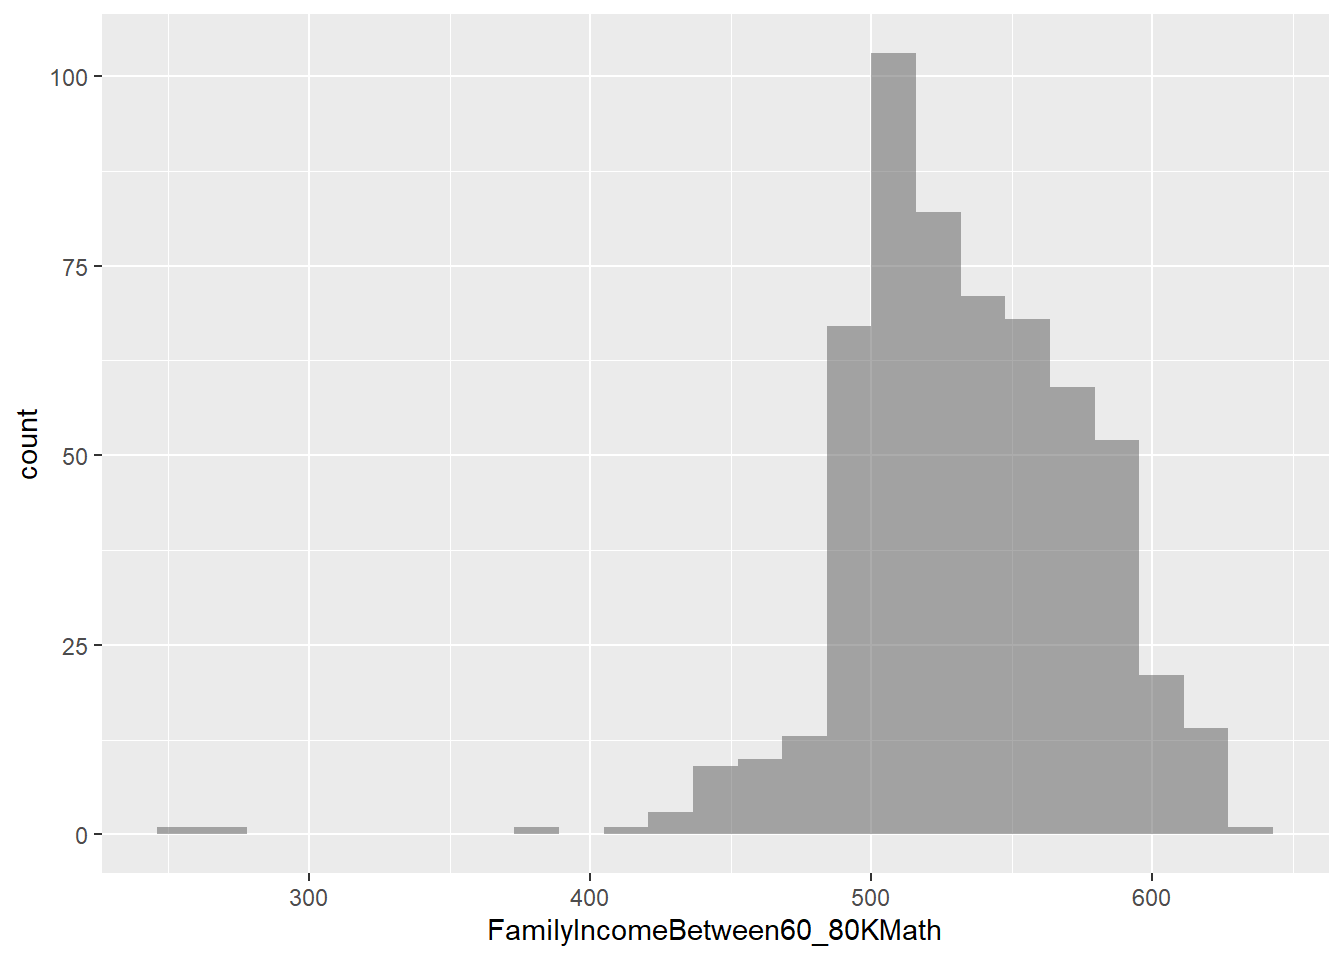
$ FamilyIncomeBetween60_80KMath <dbl> 550, 513, 524, 553, …
$ FamilyIncomeBetween60_80KTestTakers <dbl> 473, 603, 2372, 227,…
$ FamilyIncomeBetween60_80KVerbal <dbl> 564, 519, 523, 570, …
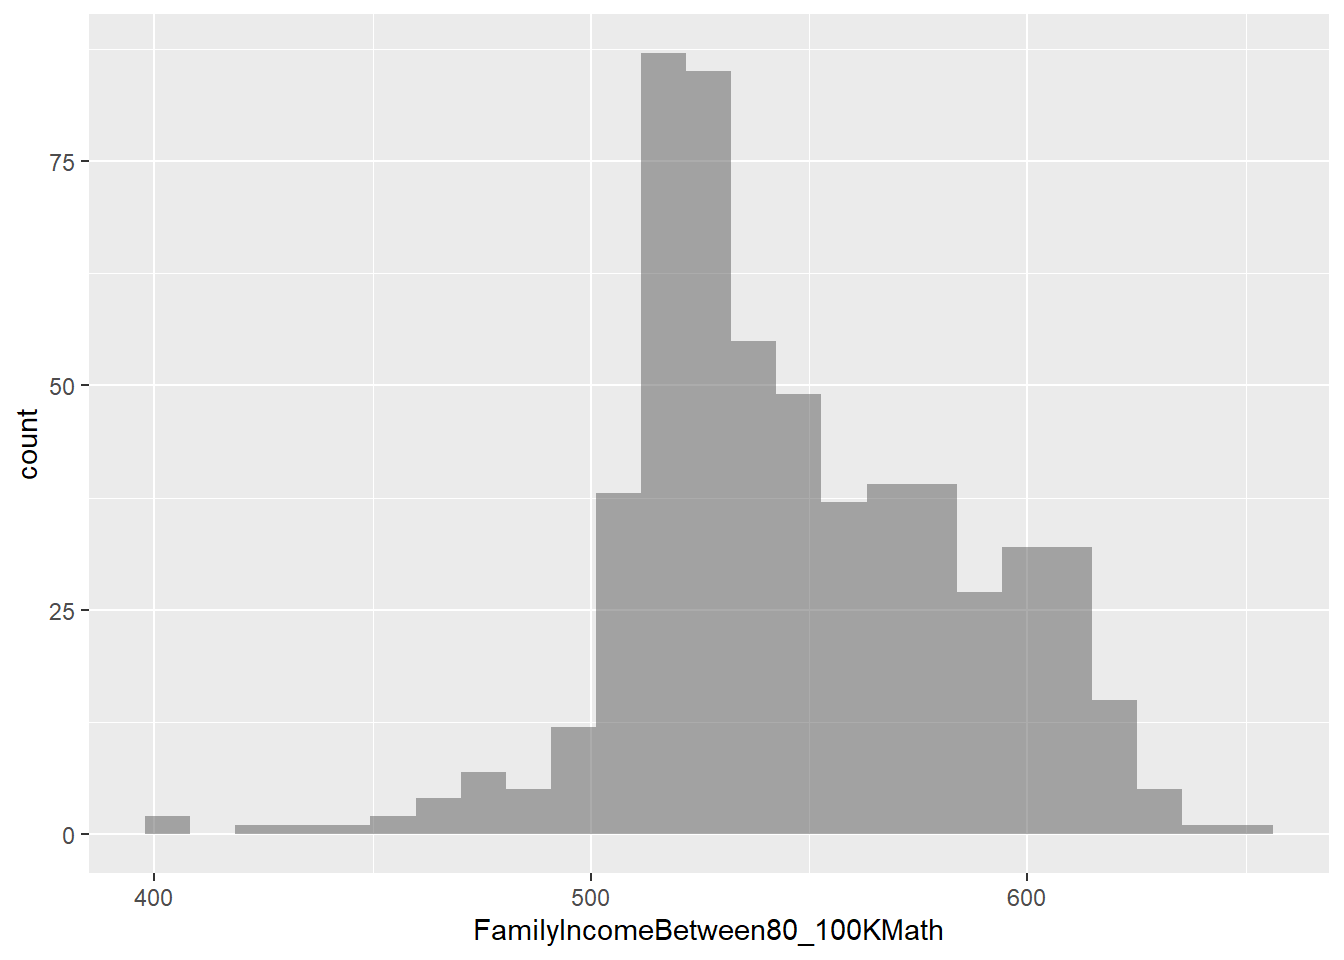
$ FamilyIncomeBetween80_100KMath <dbl> 566, 528, 534, 570, …
$ FamilyIncomeBetween80_100KTestTakers <dbl> 475, 444, 1866, 147,…
$ FamilyIncomeBetween80_100KVerbal <dbl> 577, 534, 533, 580, …
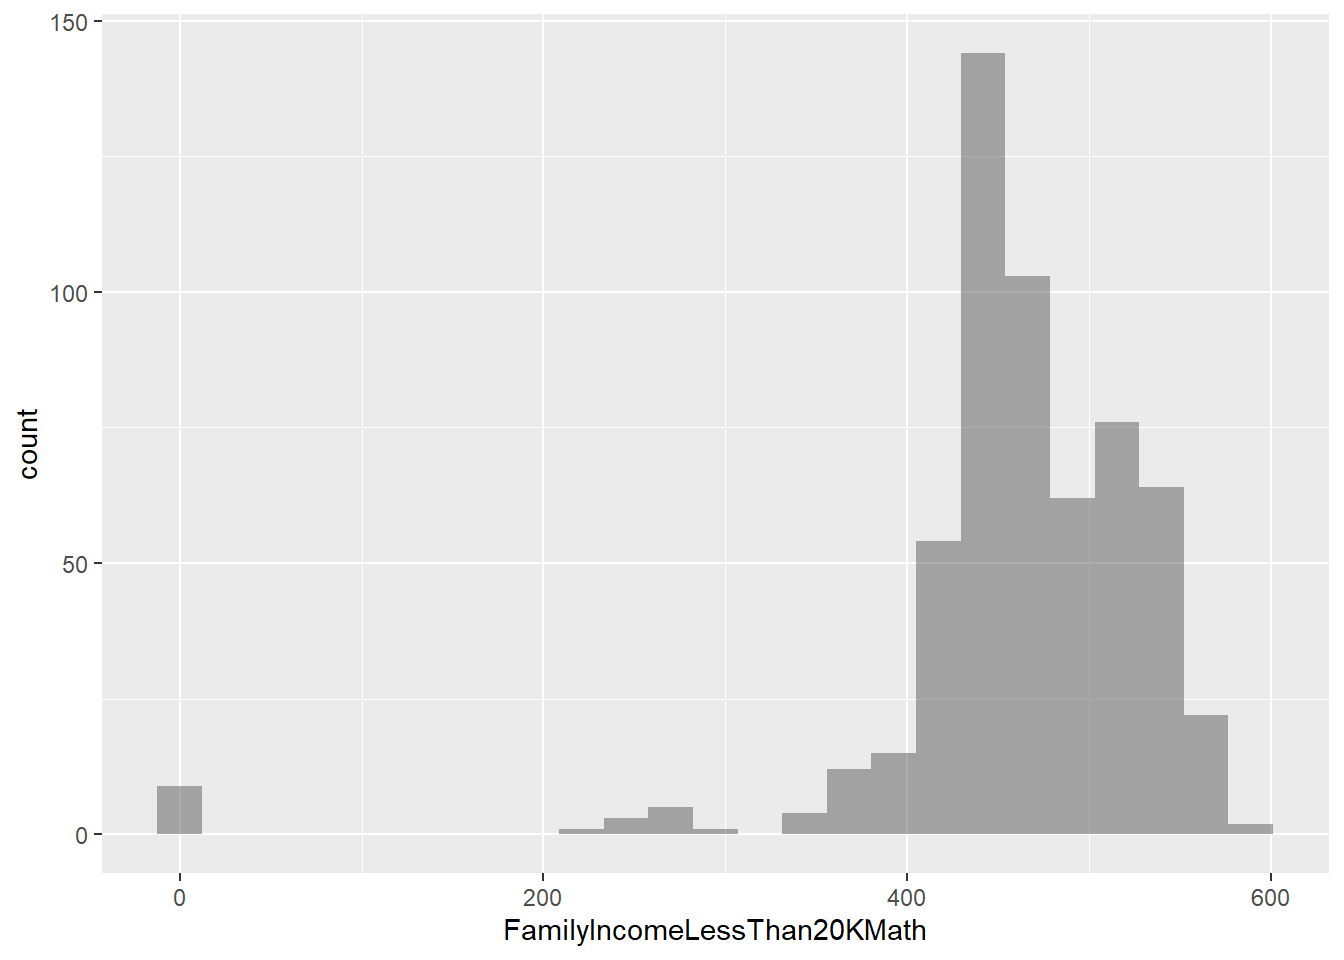
$ FamilyIncomeLessThan20KMath <dbl> 462, 464, 485, 489, …
$ FamilyIncomeLessThan20KTestTakers <dbl> 175, 191, 891, 107, …
$ FamilyIncomeLessThan20KVerbal <dbl> 474, 467, 474, 486, …
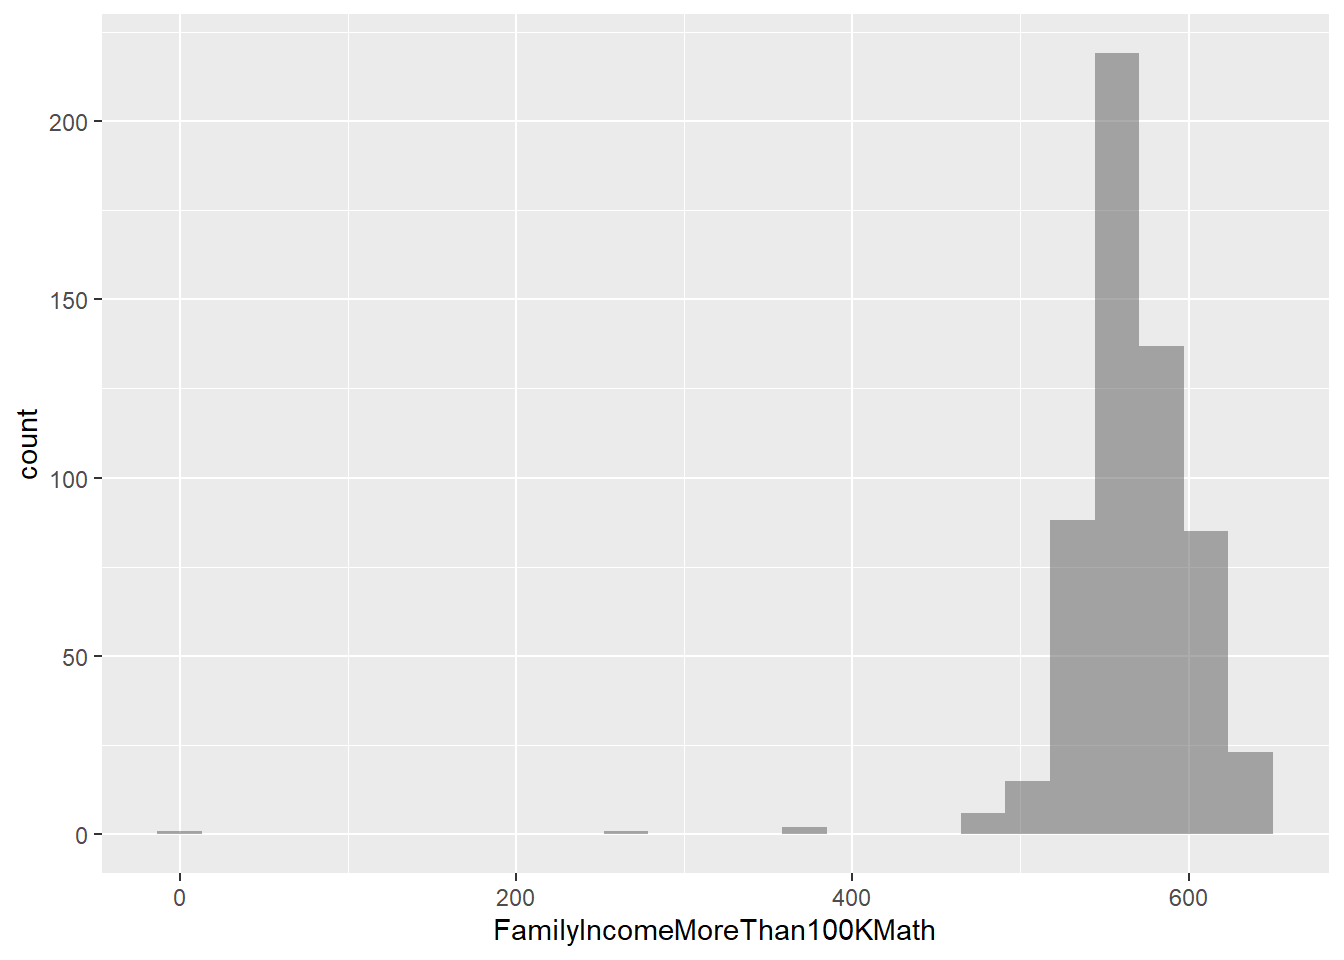
$ FamilyIncomeMoreThan100KMath <dbl> 588, 541, 554, 572, …
$ FamilyIncomeMoreThan100KTestTakers <dbl> 980, 540, 3083, 314,…
$ FamilyIncomeMoreThan100KVerbal <dbl> 590, 544, 546, 589, …
$ GpaAMinusMath <dbl> 569, 544, 541, 559, …
$ GpaAMinusTestTakers <dbl> 724, 673, 3334, 298,…
$ GpaAMinusVerbal <dbl> 575, 546, 535, 572, …
$ GpaAPlusMath <dbl> 622, 600, 605, 629, …
$ GpaAPlusTestTakers <dbl> 563, 173, 1684, 273,…
$ GpaAPlusVerbal <dbl> 623, 604, 593, 639, …
$ GpaAMath <dbl> 600, 580, 571, 579, …
$ GpaATestTakers <dbl> 1032, 671, 3854, 457…
$ GpaAVerbal <dbl> 608, 578, 563, 583, …
$ GpaBMath <dbl> 514, 492, 498, 492, …
$ GpaBTestTakers <dbl> 1253, 1622, 7193, 43…
$ GpaBVerbal <dbl> 525, 499, 499, 511, …
$ GpaCMath <dbl> 436, 466, 458, 419, …
$ GpaCTestTakers <dbl> 188, 418, 1184, 57, …
$ GpaCVerbal <dbl> 451, 472, 464, 436, …
$ GpaDOrLowerMath <dbl> 0, 424, 439, 0, 419,…
$ GpaDOrLowerTestTakers <dbl> 0, 12, 16, 0, 240, 1…
$ GpaDOrLowerVerbal <dbl> 0, 466, 435, 0, 408,…
$ GpaNoResponseMath <dbl> 0, 0, 0, 0, 0, 0, 0,…
$ GpaNoResponseTestTakers <dbl> 225, 427, 919, 78, 1…
$ GpaNoResponseVerbal <dbl> 0, 0, 0, 0, 0, 0, 0,…
$ GenderFemaleMath <dbl> 538, 505, 513, 536, …
$ GenderFemaleTestTakers <dbl> 2072, 2161, 9806, 85…
$ GenderFemaleVerbal <dbl> 561, 521, 522, 558, …
$ GenderMaleMath <dbl> 582, 535, 549, 570, …
$ GenderMaleTestTakers <dbl> 1913, 1835, 8378, 74…
$ GenderMaleVerbal <dbl> 574, 526, 531, 570, …
$ ScoreRangesBetween200To300MathFemales <dbl> 22, 30, 119, 12, 297…
$ ScoreRangesBetween200To300MathMales <dbl> 10, 20, 72, 7, 1453,…
$ ScoreRangesBetween200To300MathTotal <dbl> 32, 50, 191, 19, 443…
$ ScoreRangesBetween200To300VerbalFemales <dbl> 14, 26, 115, 9, 3382…
$ ScoreRangesBetween200To300VerbalMales <dbl> 17, 26, 86, 3, 2433,…
$ ScoreRangesBetween200To300VerbalTotal <dbl> 31, 52, 201, 12, 581…
$ ScoreRangesBetween300To400MathFemales <dbl> 173, 233, 881, 68, 1…
$ ScoreRangesBetween300To400MathMales <dbl> 93, 153, 450, 31, 71…
$ ScoreRangesBetween300To400MathTotal <dbl> 266, 386, 1331, 99, …
$ ScoreRangesBetween300To400VerbalFemales <dbl> 123, 218, 739, 46, 1…
$ ScoreRangesBetween300To400VerbalMales <dbl> 84, 171, 613, 42, 10…
$ ScoreRangesBetween300To400VerbalTotal <dbl> 207, 389, 1352, 88, …
$ ScoreRangesBetween400To500MathFemales <dbl> 514, 696, 3215, 210,…
$ ScoreRangesBetween400To500MathMales <dbl> 293, 485, 1948, 137,…
$ ScoreRangesBetween400To500MathTotal <dbl> 807, 1181, 5163, 347…
$ ScoreRangesBetween400To500VerbalFemales <dbl> 430, 656, 3048, 183,…
$ ScoreRangesBetween400To500VerbalMales <dbl> 332, 552, 2398, 141,…
$ ScoreRangesBetween400To500VerbalTotal <dbl> 762, 1208, 5446, 324…
$ ScoreRangesBetween500To600MathFemales <dbl> 722, 813, 3576, 316,…
$ ScoreRangesBetween500To600MathMales <dbl> 614, 616, 3152, 244,…
$ ScoreRangesBetween500To600MathTotal <dbl> 1336, 1429, 6728, 56…
$ ScoreRangesBetween500To600VerbalFemales <dbl> 690, 729, 3661, 302,…
$ ScoreRangesBetween500To600VerbalMales <dbl> 617, 596, 3101, 236,…
$ ScoreRangesBetween500To600VerbalTotal <dbl> 1307, 1325, 6762, 53…
$ ScoreRangesBetween600To700MathFemales <dbl> 485, 342, 1688, 204,…
$ ScoreRangesBetween600To700MathMales <dbl> 611, 445, 2126, 239,…
$ ScoreRangesBetween600To700MathTotal <dbl> 1096, 787, 3814, 443…
$ ScoreRangesBetween600To700VerbalFemales <dbl> 596, 423, 1831, 242,…
$ ScoreRangesBetween600To700VerbalMales <dbl> 613, 375, 1679, 226,…
$ ScoreRangesBetween600To700VerbalTotal <dbl> 1209, 798, 3510, 468…
$ ScoreRangesBetween700To800MathFemales <dbl> 156, 47, 327, 49, 54…
$ ScoreRangesBetween700To800MathMales <dbl> 292, 116, 630, 83, 8…
$ ScoreRangesBetween700To800MathTotal <dbl> 448, 163, 957, 132, …
$ ScoreRangesBetween700To800VerbalFemales <dbl> 219, 109, 412, 77, 5…
$ ScoreRangesBetween700To800VerbalMales <dbl> 250, 115, 501, 93, 4…
$ ScoreRangesBetween700To800VerbalTotal <dbl> 469, 224, 913, 170, …